I’ve written about R squared a few times before. In a discussion I was involved with today the question was raised as to how/whether the R squared in a linear regression model with a single continuous predictor depends on the variance of the predictor variable. The answer to the question is of course yes.
An algebraic explanation
Let’s suppose the simplest possible linear model between an outcome  and continuous predictor
  :
:

The (true) R squared of the regression model is the proportion of variance in the outcome that is explained by the predictor . The variance explained by is the variance of the linear predictor:

The total variance of the outcome in the population is then the sum of the variance of the linear predictor and the variance of the residuals,  . Thus the true population R squared is:

Suppose now that we consider how well predicts (using R squared) in a restricted population, where we restrict on the basis of values of (in some way). If we do this, the variance of in the restricted population will be reduced, relative to its variance in the original population. Using the preceding formula for R squared, we can see that the effect of this will be to reduce R squared. In the extreme, if we restricted to those individuals with values in a very small range, the variance of in the restricted population would be almost zero, such that R squared would be close to zero.
A visual illustration
We can also visualize the preceding concept easily in R. We first simulate data from a linear model with a very large sample size:
n <- 10000
set.seed(456)
x <- 100*runif(n)
y <- x+rnorm(n)
If we plot against in the total sample, using
plot(x,y)
we have:
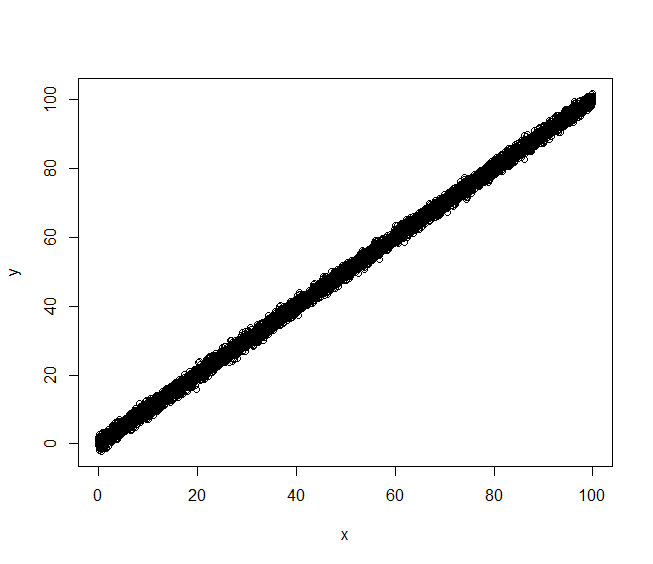
Visually, it appears that is a very good predictor of . Fitting the corresponding linear model confirms this:
summary(lm(y~x))

Call:
lm(formula = y ~ x)

Residuals:
    Min      1Q  Median      3Q     Max
-4.1295 -0.6794 -0.0023  0.6879  3.5579

Coefficients:
             Estimate Std. Error  t value Pr(>|t|)
(Intercept) 0.0068489  0.0204500    0.335    0.738
x           0.9999752  0.0003534 2829.539   <2e-16 ***
---
Signif. codes:  0 ‘***’ 0.001 ‘**’ 0.01 ‘*’ 0.05 ‘.’ 0.1 ‘ ’ 1

Residual standard error: 1.015 on 9998 degrees of freedom
Multiple R-squared:  0.9988,	Adjusted R-squared:  0.9988
F-statistic: 8.006e+06 on 1 and 9998 DF,  p-value: < 2.2e-16
giving an R squared 0.9988.
Next, we plot the data again, but restricted to those with  :
:
plot(x[x<1],y[x<1])
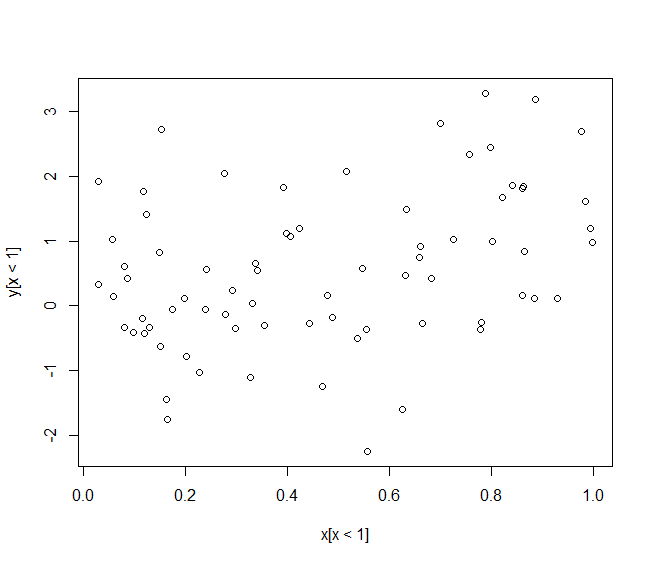
Now, visually at least, appears to explain a much smaller proportion of the variance of the outcome, and fitting the linear model to the restricted sample confirms this:
summary(lm(y[x<1]~x[x<1]))

Call:
lm(formula = y[x < 1] ~ x[x < 1])

Residuals:
     Min       1Q   Median       3Q      Max
-2.93421 -0.73513 -0.09459  0.69282  2.59506

Coefficients:
            Estimate Std. Error t value Pr(>|t|)
(Intercept)  -0.0893     0.2432  -0.367  0.71459
x[x < 1]      1.3960     0.4386   3.183  0.00215 **
---
Signif. codes:  0 ‘***’ 0.001 ‘**’ 0.01 ‘*’ 0.05 ‘.’ 0.1 ‘ ’ 1

Residual standard error: 1.121 on 72 degrees of freedom
Multiple R-squared:  0.1233,	Adjusted R-squared:  0.1112
F-statistic: 10.13 on 1 and 72 DF,  p-value: 0.002155
with a much lower R squared value of 0.1233.
Hi, could you please provide an answer what happens with R squared if the variance of outcome variable becomes restricted? Thank you!
Thanks for your question. I think to answer it I would need to better understand how you are thinking the outcome variable would be restricted. You say the variance of the outcome being restricted. Do you mean for example that the data are restricted by the y value having to lie in a certain range/interval?