When we include a continuous variable as a covariate in a regression model, it’s important that we include it using the correct (or something approximately correct) functional form. For example, with a continuous outcome Y and continuous covariate X, it may be the case that the expected value of Y is a linear function of X and X^2, rather than a linear function of X. For linear regression there are a number of ways of assessing what the appropriate functional form is for a covariate. A simple but often effective approach is simply to look at a scatter plot of Y against X, to visually assess the shape of the association.
With a binary outcome which we typically model using logistic regression things are not quite as easy (at least when trying to use graphical methods). For a start, the scatter plot of Y against X is now entirely uninformative about the shape of the association between Y and X, and hence how X should be include in the logistic regression model. To illustrate, using R let’s simulate some (X,Y) data where Y follows a logistic regression with X entering linearly in the model:
set.seed(1234)
n <- 1000
x <- rnorm(n)
xb <- -2+x
pr <- exp(xb)/(1+exp(xb))
y <- 1*(runif(n) < pr)
Now if we plot Y against X, we get the following
plot(x,y)
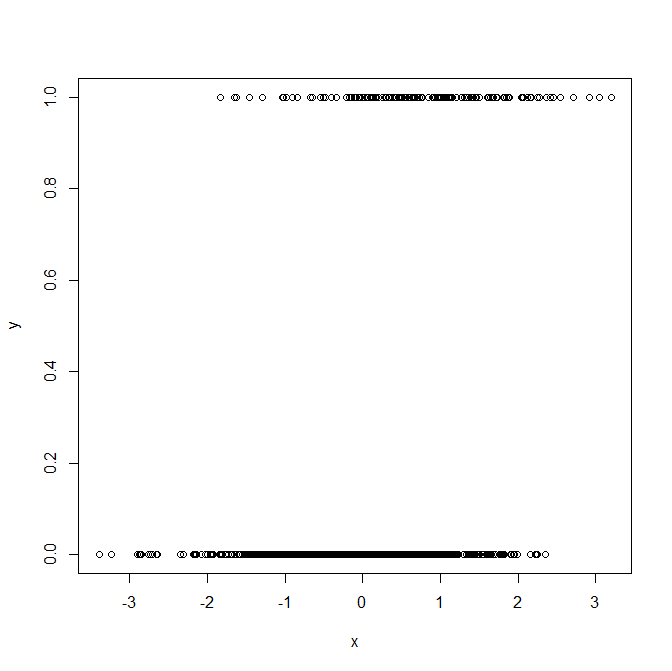
This is entirely uninformative regarding how Y depends on X, due to the binary nature of Y.
The loess/lowess plot
One approach to overcome this problem is rather than plotting individual (Y,X) values, to plot a smoothed line of how the average value of Y changes with X. The simplest type of smoother is a running mean, where at a given value X=x, the line is equal to the mean (possibly weighted somehow) of the Y values. The mean values at each value of X are then joined up to give a smoothed line. The amount of smoothing is controlled by the width of the window used in the averaging, or how quickly (in X) the weighting drops to zero. For more on this approach more generally, see the Wikipedia page on kernel regression.
The loess/lowess technique is a slightly more complicated version, where instead of calculating a (possibly weighted) mean of the Y values in a neighbourhood of X=x, we fit a regression line (e.g. linear) to the data around X=x. By doing this, we assume that locally the Y-X association is linear, but without assuming that it is globally linear. An advantage of this over taking a simple mean is that we need less data to obtain a good estimate of how Y depends on X. Whereas with the running mean we may calculate a weighted mean, where the weight of an observation is higher the closer its value of X is to x, with loess we fit the local linear model using weighted least square, giving less weight to observations with X values further away from X=x.
Using loess to check functional form for logistic regression
Let's return to our original aim, of checking how X should be entered in the logistic regression model for Y. What we can do is perform loess on our (Y,X) data to try and see how the mean of Y varies as a function of X:
plot(x,predict(loess(y~x)))
which gives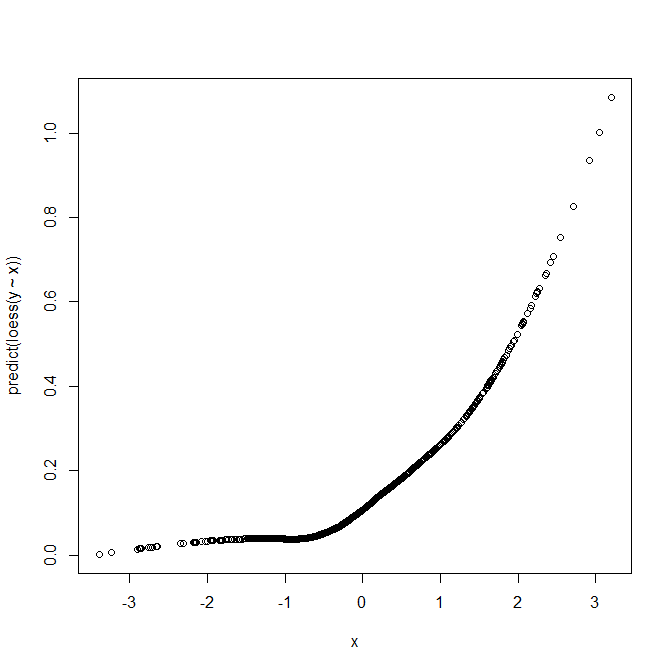
This plot suggests that the mean of Y is not linear in X, but is perhaps quadratic. How do we reconcile this with the fact that we generated the data from a model where X enters linearly? The explanation is that in logistic regression we model the logit of the probability that Y=1 as a function of the predictors, not the probability itself. The logit function is actually very close to linear for probabilities that are not close to zero or one, and in datasets where the probabilities are not close to zero or one, this is less of an issue. However at least in the situations I often deal with (e.g. cohort studies with fairly low proportions of individuals experiencing the event of interest), the probabilities are often quite small.
We can overcome this by plotting the logit of the estimated probabilities (mean of Y) which loess is calculating for us. In Stata, the lowess command has a logit option, which gives a plot of the smoothed logit against X. In R we can write a short function to do the same:
logitloess <- function(x, y, s) {

logit <- function(pr) {
	log(pr/(1-pr))
}

if (missing(s)) {
	locspan <- 0.7
} else {
	locspan <- s
}

loessfit <- predict(loess(y~x,span=locspan))
pi <- pmax(pmin(loessfit,0.9999),0.0001)
logitfitted <- logit(pi)

plot(x, logitfitted, ylab="logit")

}
To produce our smoothed logit plot, we now just call our function with X an Y:
logitloess(x,y)
which gives
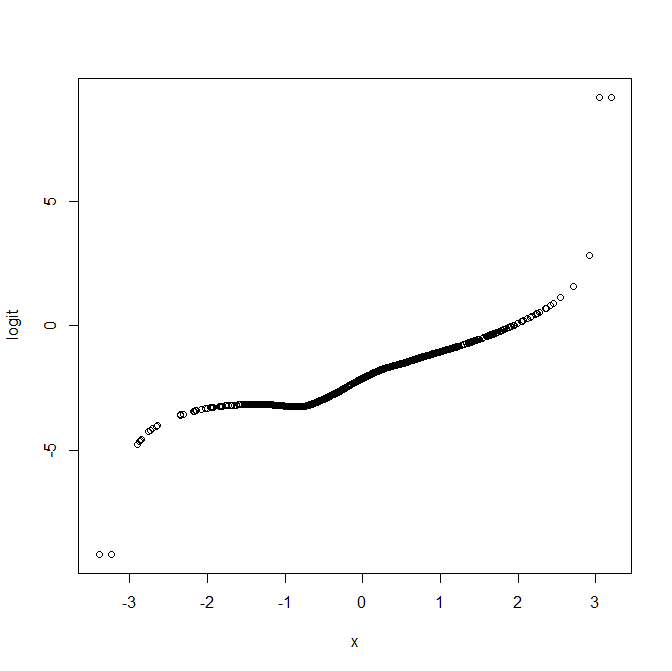
We now have a plot that looks a lot more linear, as it should. Because the loess does not assume any particular functional form, there will always be some noise in the estimated regression line. The amount of smoothing can be controlled in loess using the span argument, and in the logitloess function we have just defined, this can be controlled using the third argument s (the default value is 0.7). There is a vast literature on methods for choosing this parameter, but for our purposes here a reasonable approach is just to try some different values and explore how the line changes.
A further thing to note is that the estimated logit will be much more imprecise in regions where there are few X values. Here we generated X from a normal distribution, and we can see from the plot that there are only a few X values less than -2 or greater than +2 (as we would expect!). Consequently we should not pay too much attention to what the estimate logit value is in these areas of the X space.
Testing a situation with quadratic X effects
As another example, we now re-simulate our data, but this time specify that the logit of the probability that Y=1 is a quadratic function of the covariate X, rather than linear:
set.seed(12345)
n <- 1000
x <- rnorm(n)
xb <- -2+x^2
pr <- exp(xb)/(1+exp(xb))
y <- 1*(runif(n) < pr)
logitloess(x,y)
which gives
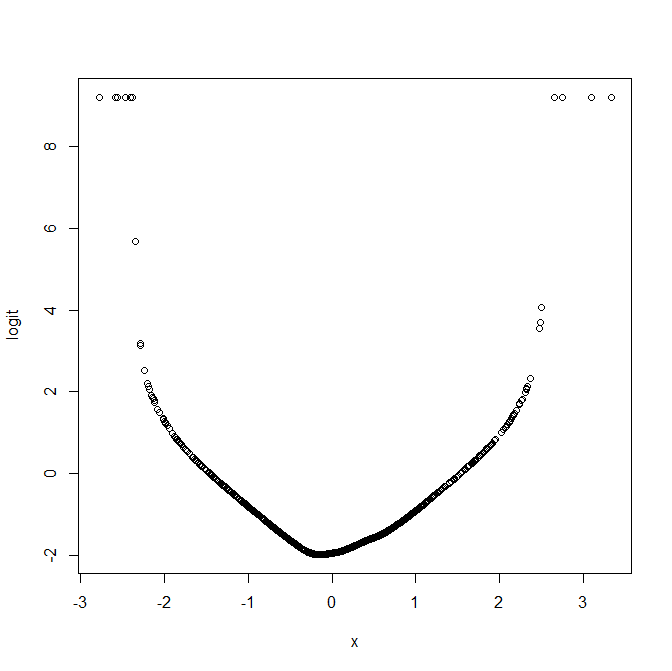
This shows that an assumption of a linear effect of X, on the logit scale, is clearly not reasonable here. Further, the plot visually suggests that a quadratic effect of X may well be a reasonable way to include X in the model.
Caveats
The approach we have looked at here is obviously not perfect and will be more or less useful in different situations. With small datasets (e.g. n=50) there is really not enough data to nonparametrically estimate how the mean of Y depends on X, and so using loess isn't really going to be useful. Even with large datasets the functional form suggested in the loess plot could look quite strange purely as a result of imprecision because there isn't much data in certain parts of the X space/distribution. Consequently it's important to judge the plots in light of the distribution of X. Nonetheless, the loess plot is a useful tool when trying to work out how to model the effect of a continuous covarate in logistic regression.
This post may have literally saved my PhD thesis! I wanted to say thank you for taking the time to explain this so beautifully!
Thanks Jonathan for sharing this.
I am wonder if I could use the predicted Y (output of LOESS) as a predictor in the logistic regression model? Using the prediction looks like the WOE transformation but will this cause the information leakage?
Maybe I misunderstand your suggestion, but I don’t quite see why you would want to use the predicted Y based on LOESS as a predictor in a second stage logistic regression. If you want to model the effect of the covariate more flexibly you can include higher order terms in the logistic, or use more flexible methods such as splines or generalised additive models.
Thanks Jonathan. The reason why I want to transform the covariate is that the raw covariate is highly skewed and does not show much predictive power. So I was thinking maybe some transformation of the covariate may improve this. Thanks for your advice, I think smoothing spline is another approach that I could try.
Regards,